Many factors affect a vehicle’s market value but two of the most important factors are vehicle age and mileage. The average American vehicle travels about 14,000 miles per year, per the 2019 FHA data. Most publicly available depreciation estimates are a formulated as a function of vehicle age age and they assume each year of vehicle age comes with roughly 14,000 miles of travel.
Vehicle depreciation is an important financial cost incurred by vehicle owners and it is important to understand how a vehicle will depreciate as a function of both vehicle age and mileage. What is the expected depreciation cost for someone who works from home and barely puts any miles on their car each year? What is the expected depreciation cost for a traveling salesman who will add well over 14,000 miles per year to their vehicle?
The data
To answer these questions we look to an open dataset of vehicle listings scraped from Craigslist. This dataset comes with a few important caveats, the largest of which is that listing prices are not sales prices. Listing prices can be negotiated (typically downwards) and the final transaction price is not actually known. The rest of this post assumes that listing prices are good proxies for sales prices and I think in normal market conditions this is a fairly reasonable assumption.
I start by filtering for a point-in-time snapshot of listings from May, 2021 in order to simplify this analysis. Craigslist listings are far from curated so I filtered out listings with extreme attributes to keep the dataset broadly representative of the average vehicle:
- remove listings with vehicle years < 2000 to excluded vintage cars and typos
- remove listings with odometer listings <= 500 miles to focus on used cars
- remove listings with odometer listings >= 300,000 miles to exclude outliers and typos
- remove listings with prices <= 1000 and >= 70,000 USD to exclude outliers
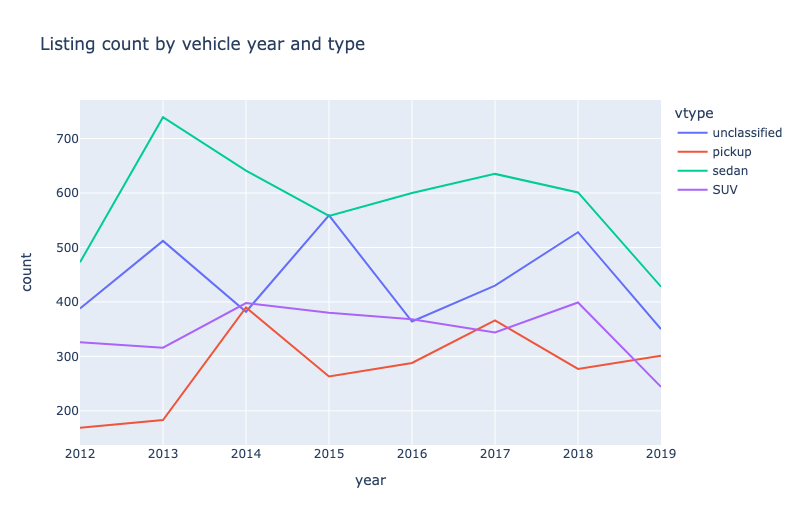
There were nearly 24,000 listings after implementing these filters, and these listings are distributed relatively evenly across vehicle age and type.
What is the real depreciation cost of a mile
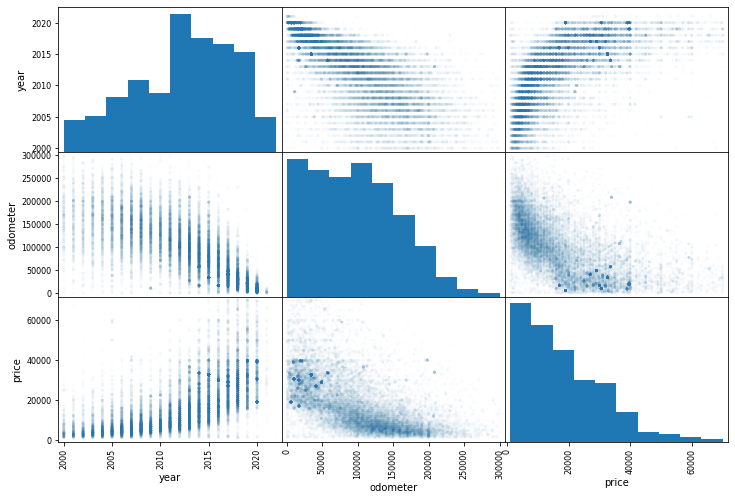
The scatter matrix below shows a high degree of multicollinearity. Intuitively listing price is strongly negatively correlated with both mileage and vehicle age, while mileage is strongly positively correlated with vehicle age.
Scatter matrix of listing price, odometer, and make year
Regressing price on mileage and age, we estimate:
- each vehicle year is associated with a 12,000 USD decrease in listing price
- each mile is associated with a 0.05 USD decrease in listing price
- new vehicles have an estimated listing price of 34,000 USD 1
                            OLS Regression Results
==============================================================================
Dep. Variable:                  price   R-squared:                       0.450
Model:                            OLS   Adj. R-squared:                  0.450
Method:                 Least Squares   F-statistic:                     9607.
Date:                Mon, 19 Dec 2022   Prob (F-statistic):               0.00
Time:                        06:01:18   Log-Likelihood:            -2.4934e+05
No. Observations:               23518   AIC:                         4.987e+05
Df Residuals:                   23515   BIC:                         4.987e+05
Df Model:                           2
Covariance Type:            nonrobust
==============================================================================
                 coef    std err          t      P>|t|      [0.025      0.975]
------------------------------------------------------------------------------
const       3.368e+04    129.221    260.648      0.000    3.34e+04    3.39e+04
odometer      -0.0547      0.001    -37.733      0.000      -0.058      -0.052
years_old  -1184.2888     17.303    -68.443      0.000   -1218.205   -1150.373
==============================================================================
Omnibus:                     5234.108   Durbin-Watson:                   1.661
Prob(Omnibus):                  0.000   Jarque-Bera (JB):            12872.939
Skew:                           1.231   Prob(JB):                         0.00
Kurtosis:                       5.661   Cond. No.                     2.34e+05
==============================================================================

Notes:
[1] Standard Errors assume that the covariance matrix of the errors is correctly specified.
[2] The condition number is large, 2.34e+05. This might indicate that there are
strong multicollinearity or other numerical problems.
How do these estimates vary by vehicle type? Running the same OLS regression specification on three different datasets filtered for specific vehicle types, we estimate:
- Pickup price = 44,000 - 0.04 * odometer - 1,600 * years_old
- SUV price = 34,000 - 0.07 * odometer - 1,000 * years_old
- Sedan price = 28,000 - 0.09 * odometer - 600 * years_old
Based on these estimates we can infer that pickups tend to deprecate fairly quickly with vehicle age but are relatively stable as more miles are added to the odometer. Sedans, in contrast, tend to lose more value with each mile but hold up well as the years pass. It is not obvious why these differences exist but some of this could be due to how much more capable today’s pickup trucks are in terms of towing capacity and other related advancements. Another factor could be the prevalence of diesel engines in the pickup category, as diesel engines have a reputation for lasting for more miles than gasoline engines. There could also be structural differences in the work truck market that make buyers less sensitive to miles and more sensitive to vehicle age.
I previously noted there was some multicollinearity in our data. I calculated the VIF factors for vehicle age and mileage to be 1.97 which is moderate. Below we answer the same question as above in a simpler way to skirt around the multicollinearity issue altogether.
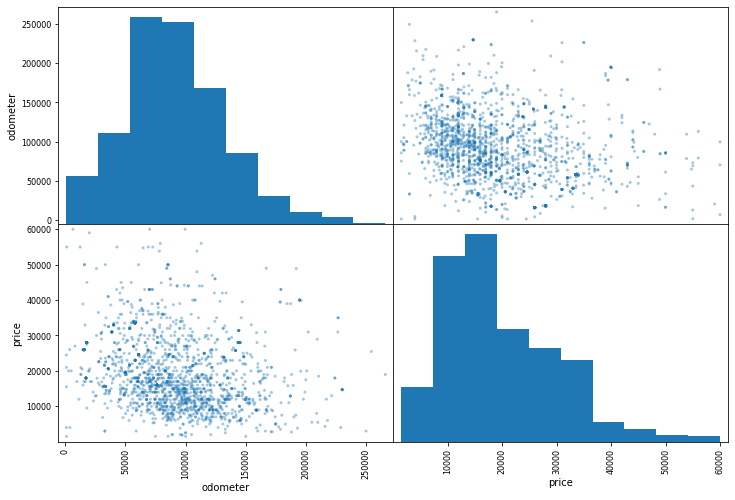
If we group vehicles by the same age then what is the association between mileage and sales price? Filtering for vehicles with a make year of 2014 then we see a much smaller correlation between odometer and listing price than before. Whereas the overall correlation between odometer and price(across all vehicle years) is -58%, the same correlation in 2014 specifically is only -27%. Running the same regression specification for 2014 vehicle years only we estimate a coefficient of -0.07, which is quite close to the coefficient estimated above.
Scatter matrix of listing price and odometer for vehicles made in 2014
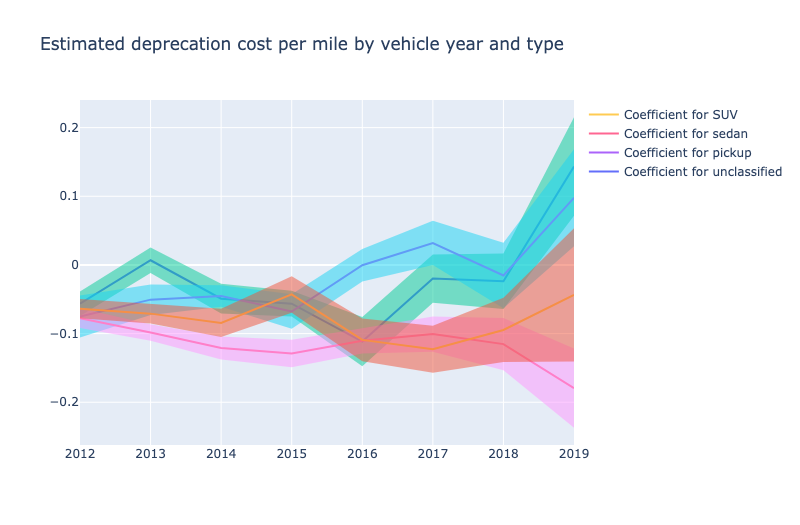
Repeating this process for each vehicle year and also splitting by vehicle type, we estimate that each new mile is still associated with a roughly 0.05 USD decrease in listing price on average; however, there is some notable variation by vehicle type and year. Newer vehicle years tend to have lower mileage depreciation estimates than other years (i.e., more positive coefficients). The newest pickup trucks even have positive mileage depreciation estimates. Obviously, a pickup does not increase in value with more miles added so there must be confounding factors which can be explored in future analyses.
Footnotes
-
As a quick sense check the average sales price of a new car in the US in 2020 was about 39,000 USD and a rule of thumb is that a new car deprecates 10% by driving it off the lot. These stats imply a used car with zero age and zero miles should cost about 35,000 USD which is quite close to the regression constant. ↩