In this post I introduce the Company Vector, a distributed representation of a company’s core business activities. Company vectors are learned from business descriptions found in public SEC 10-K filings using an unsupervised learning algorithm called the Paragraph Vector. The learned vectors can be used to compare companies to each other and to support various machine learning tasks relating to company-centric analytics.
Background
Deep learning has produced some amazing results over the last several years across a wide range of applications, including image recognition and natural language processing. One of the reasons deep learning is so powerful is because it is able to map inputs to outputs in nonlinear ways. In doing so, it can create useful representations of those inputs along the way.
One particularly interesting example of this is the Word Vector, which represents words as high dimensional vectors. These vectors are learned as the byproduct of a prediction task: to predict which words surround a given word in a sentence, or alternatively, to predict a word given its context. Faced with this task, the model learns to efficiently represent each word as a set of numbers, called a word vector. These vectors can be used to compare words to each other and to complete word analogies, amongst other tasks1.
The Paragraph Vector, recently introduced by Google (Le; Mikolov, 2014), represents a sequence of multiple words as a high dimensional vector. It extends the word vector methodology by forcing the model to keep track of an additional paragraph token during training. This token is not associated with any particular word but is present for each training observation drawn from that paragraph, allowing the model to capture the topic of the paragraph.
Learned company representations
I used the Gensim implementation of paragraph vectors, called doc2vec, to learn a 100 dimensional vector representation of each company’s business activities. The model was trained on a corpus of business descriptions scraped from annual 10-K filings. Specifically, the corpus was populated with text from Item 1 of each company’s 10-K; the SEC describes Item 1 as follows:
Item 1 - “Business” requires a description of the company’s business, including its main products and services, what subsidiaries it owns, and what markets it operates in. This section may also include information about recent events, competition the company faces, regulations that apply to it, labor issues, special operating costs, or seasonal factors. This is a good place to start to understand how the company operates.
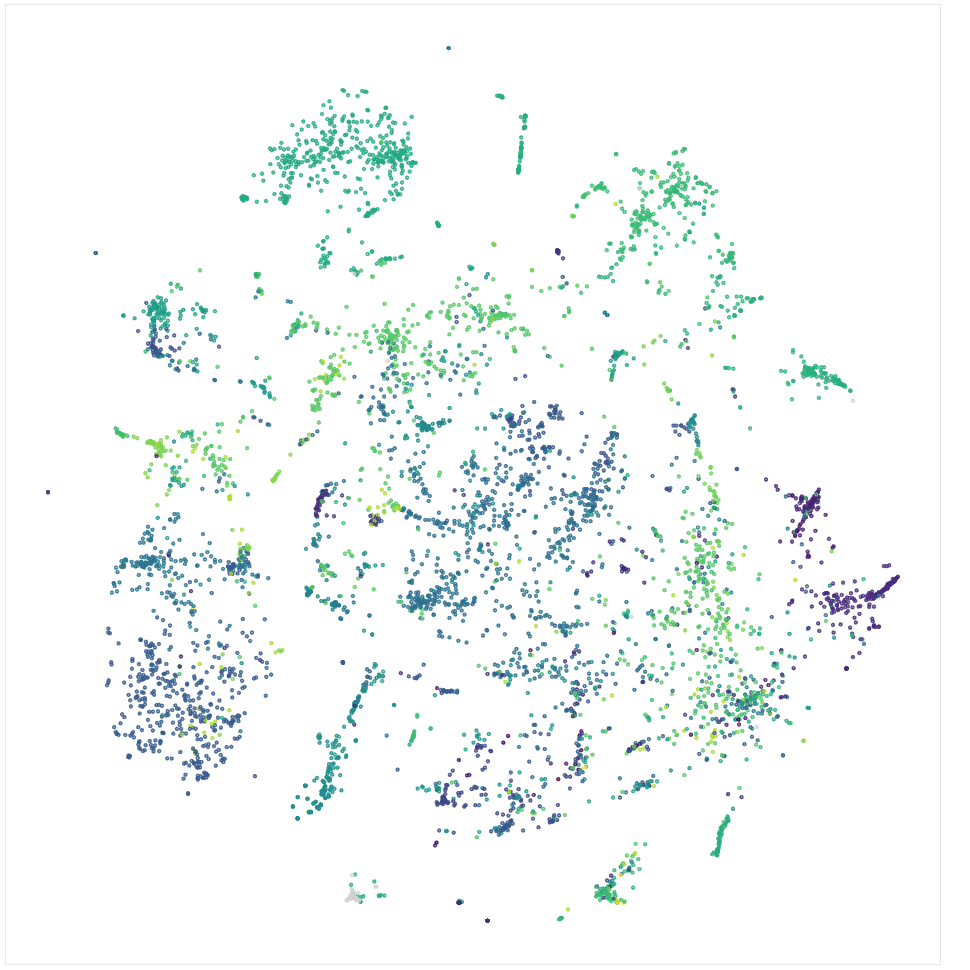
A simplified version of the learned company vectors can be plotted using dimensionality reduction. Figure 1 below depicts the 100 dimensional vectors reduced to two dimensions with t-SNE. Each point in the plot represents one company, and the color of the point represents that company’s SIC code, a four-digit code intended to classify a company’s primary business activities. A clear pattern emerges, where companies of similar SIC codes tend to appear in close proximity to each other, even though the model never saw the SIC codes. These clusters of similarly coded companies indicate the model is doing a good job of learning what a company does for a living.
Figure 1: t-SNE company vector reduction
Company vectors can also be used to compare companies to each other by comparing the distance between the vectors of those companies (e.g., Euclidean distance, cosine similarity). Table 1 below shows the companies corresponding to the five nearest company vectors for a few examples2.
Table 1: Sample of nearest company vectors
(SIC codes in [brackets])
| Company | Similar companies | Cosine similarity |
|---|---|---|
| PepsiCo Inc [2080] | Cott Corp [2086] | 81% |
| General Mills Inc [2040] | 81% | |
| Treehouse Foods Inc [2030] | 79% | |
| Kraft Foods Group Inc [2000] | 78% | |
| Lancaster Colony Corp [2030] | 78% | |
| Gogo Inc [4899] | Global Eagle Entertainment Inc [4899] | 81% |
| Spirit Airlines Inc [4512] | 77% | |
| Virgin America Inc [4512] | 75% | |
| Hawaiian Holdings Inc [4512] | 75% | |
| American Airlines Inc [4512] | 75% | |
| KeyCorp [6021] | Huntington Bancshares Inc [6021] | 85% |
| MUFG Americas Holdings Corp [6021] | 84% | |
| Regions Financial Corp [6021] | 84% | |
| PNC Financial Services Group Inc [6021] | 84% | |
| M&T Bank Corp [6022] | 82% |
These examples illustrate that the model appears to be able to learn a lot about a company’s operations, including the type of products and services the company sells, the company’s primary region of operation, and the type of clients the company serves.
- Pepsi is a diversified food and beverage company, which makes classifying it in a single SIC code difficult. Company vectors do a good job of identifying broadly similar companies, even though they are classified under different SIC codes.
- Gogo provides connectivity solutions (e.g., in-flight WiFi) to airlines. The nearest company vector is that of Global Eagle Entertainment, another connectivity solutions provider. Several of their clients follow in the similarity list, though with noticeably lower similarity scores.
- KeyCorp is a large regional bank that conducts a lot of its business in the Midwest. The top five nearest company vectors represent companies that are generally similar in size and geography.
Company vectors can also be used to support various machine learning tasks relating to company-centric analytics by serving as features for other models. They may be useful, for example, in predicting financial performance in combination with other features.
Comparatory
In order to more easily explore the learned company representations, I built comparatory.co, a small Python Flask app. It currently provides two functions:
- Search: enter a company name and it will identify the five most similar companies based on company vector distance
- Explore: identify clusters of similar companies with an interactive low dimensional plot of reduced company vectors
Feel free to give it a try!